|
|
|
Advertisements:
EconomyEconomy - overview
Characterized by large and well-developed agricultural, mining, manufacturing, and service sectors, Brazil's economy outweighs that of all other South American countries, and Brazil is expanding its presence in world markets. Since 2003, Brazil has steadily improved its macroeconomic stability, building up foreign reserves, and reducing its debt profile by shifting its debt burden toward real denominated and domestically held instruments. In 2008, Brazil became a net external creditor and two ratings agencies awarded investment grade status to its debt. After strong growth in 2007 and 2008, the onset of the global financial crisis hit Brazil in 2008. Brazil experienced two quarters of recession, as global demand for Brazil's commodity-based exports dwindled and external credit dried up. However, Brazil was one of the first emerging markets to begin a recovery. In 2010, consumer and investor confidence revived and GDP growth reached 7.5%, the highest growth rate in the past 25 years. Rising inflation led the authorities to take measures to cool the economy; these actions and the deteriorating international economic situation slowed growth to 2.7% for 2011 as a whole, though forecasts for 2012 growth are somewhat higher. Despite slower growth in 2011, Brazil overtook the United Kingdom as the world's seventh largest economy in terms of GDP. Urban unemployment is at the historic low of 4.7% (December 2011), and Brazil's traditionally high level of income equality has declined for each of the last 12 years. Brazil's high interest rates make it an attractive destination for foreign investors. Large capital inflows over the past several years have contributed to the appreciation of the currency, hurting the competitiveness of Brazilian manufacturing and leading the government to intervene in foreign exchanges markets and raise taxes on some foreign capital inflows. President Dilma ROUSSEFF has retained the previous administration's commitment to inflation targeting by the central bank, a floating exchange rate, and fiscal restraint. Gdp (purchasing power parity) World Ranking: 8
$2.324 trillion (2011 est.)
$2.262 trillion (2010 est.) $2.103 trillion (2009 est.) Note Data are in 2011 US dollars Gdp (official exchange rate)
$2.493 trillion (2011 est.)
Gdp - real growth rate World Ranking: 129
2.7% (2011 est.)
7.5% (2010 est.) -0.3% (2009 est.) Gdp - per capita (ppp) World Ranking: 101
$11,900 (2011 est.)
$11,700 (2010 est.) $11,000 (2009 est.) Note Data are in 2011 US dollars Gdp - composition by sector
Agriculture 5.5%
Industry 27.5% Services 67% (2011 est.) Labor force World Ranking: 6
104.7 million (2011 est.)
Labor force - by occupation
Agriculture 20%
Industry 14% Services 66% (2003 est.) Unemployment rate World Ranking: 63
6% (2011 est.)
6.7% (2010 est.) Population below poverty line
21.4% (2009 est.)
Household income or consumption by percentage share
Lowest 10% 0.8%
Highest 10% 42.9% (2009 est.) Distribution of family income - gini index World Ranking: 16
51.9 (2012)
60.7 (1998) Investment (gross fixed) World Ranking: 105
19.3% of GDP (2011 est.)
Budget
Revenues $978.3 billion
Expenditures $901 billion (2011 est.) Taxes and other revenues World Ranking: 49
39.2% of GDP (2011 est.)
Budget surplus (+) or deficit (-) World Ranking: 22
3.1% of GDP (2011 est.)
Public debt World Ranking: 50
54.2% of GDP (2011 est.)
53.4% of GDP (2010 est.) Inflation rate (consumer prices) World Ranking: 153
6.6% (2011 est.)
5% (2010 est.) Central bank discount rate World Ranking: 25
11% (31 December 2011 est.)
10.75% (31 December 2010 est.) Commercial bank prime lending rate World Ranking: 4
43.88% (31 December 2011 est.)
39.992% (31 December 2010 est.) Stock of narrow money World Ranking: 21
$153 billion (31 December 2011 est.) $169.2 billion (31 December 2010 est.) Stock of broad money World Ranking: 11
$1.878 trillion (30 November 2011 est.) $1.826 trillion (31 December 2010 est.) Stock of domestic credit World Ranking: 11
$2.769 trillion (31 December 2011 est.) $2.193 trillion (31 December 2010 est.) Market value of publicly traded shares World Ranking: 10
$1.229 trillion (31 December 2011) $1.546 trillion (31 December 2010) $1.167 trillion (31 December 2009) Agriculture - products
Coffee, soybeans, wheat, rice, corn, sugarcane, cocoa, citrus; beef Industries
Textiles, shoes, chemicals, cement, lumber, iron ore, tin, steel, aircraft, motor vehicles and parts, other machinery and equipment Industrial production growth rate World Ranking: 145
0.3% (2011 est.)
Electricity - production World Ranking: 9
509.2 billion kWh (2010 est.)
Electricity - consumption World Ranking: 10
455.7 billion kWh (2010 est.)
Electricity - exports
2.98 billion kWh (2010 est.)
Electricity - imports
35.9 billion kWh; note - supplied by Paraguay and Venezuela (2010 est.) Oil - production World Ranking: 13
2.301 million bbl/day (December 2011 est.) Oil - consumption World Ranking: 12
2.029 million bbl/day (December 2011 est.) Oil - exports World Ranking: 24
801,200 bbl/day (December 2011 est.) Oil - imports World Ranking: 40
255,800 bbl/day (December 2011 est.) Oil - proved reserves World Ranking: 15
12.86 billion bbl (1 January 2011 est.) Natural gas - production World Ranking: 28
24.07 billion cu m (2011 est.)
Natural gas - consumption World Ranking: 30
25.13 billion cu m (2011 est.)
Natural gas - exports World Ranking: 67
0 cu m (2011 est.)
Natural gas - imports World Ranking: 20
12.48 billion cu m (2011 est.)
Natural gas - proved reserves World Ranking: 35
366.4 billion cu m (1 January 2011 est.) Current account balance World Ranking: 187
-$52.59 billion (2011 est.)
-$47.32 billion (2010 est.) Exports World Ranking: 23
$256 billion (2011 est.)
$201.9 billion (2010 est.) Exports - commodities
Transport equipment, iron ore, soybeans, footwear, coffee, autos Exports - partners
China 17.3%, US 10.1%, Argentina 8.9%, Netherlands 5.3% (2011) Imports World Ranking: 23
$219.6 billion (2011 est.)
$181.8 billion (2010 est.) Imports - commodities
Machinery, electrical and transport equipment, chemical products, oil, automotive parts, electronics Imports - partners
US 15.1%, China 14.5%, Argentina 7.5%, Germany 6.7%, South Korea 4.5% (2011) Reserves of foreign exchange and gold World Ranking: 7
$352 billion (31 December 2011 est.) $288.6 billion (31 December 2010 est.) Debt - external World Ranking: 26
$397.5 billion (31 December 2011 est.) $347 billion (31 December 2010 est.) Stock of direct foreign investment - at home World Ranking: 15
$435.1 billion (31 December 2011 est.) $368.4 billion (31 December 2010 est.) Stock of direct foreign investment - abroad World Ranking: 25
$119.7 billion (31 December 2011 est.) $129 billion (31 December 2010 est.) Exchange rates
Reals (BRL) per US dollar -
1.6728 (2011 est.) 1.7592 (2010 est.) 2 (2009) 1.8644 (2008) 1.85 (2007) Fiscal year
Calendar year
Comments
Add a new comment: |
Advertisement
Members area
Brazil (Brasilia):
GPS points from Brazil (Brasilia)
|
||||||||
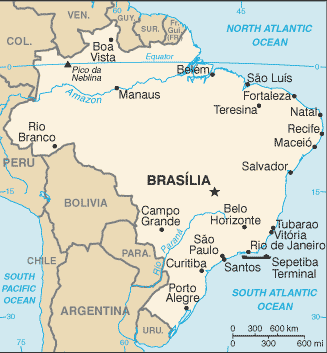
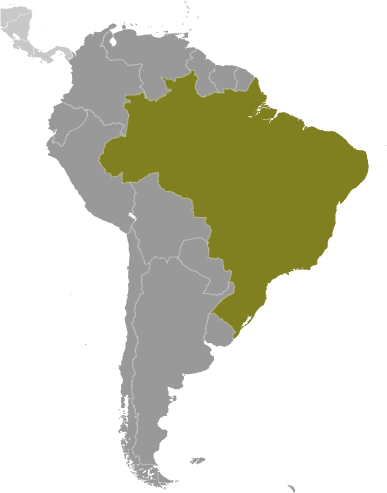
 Following more than three centuries under Portuguese rule, Brazil gained its independence in 1822, maintaining a monarchical system of government until the abolition of slavery in 1888 and the subsequent proclamation of a republic by the military in 1889. Brazilian coffee exporters politically dominated the country until populist leader Getulio VARGAS rose to power in 1930. By far the largest and most populous country in South America, Brazil underwent more than a half century of populist and military government until 1985, when the military regime peacefully ceded power to civilian rulers. Brazil continues to pursue industrial and agricultural growth and development of its interior. Exploiting vast natural resources and a large labor pool, it is today South America's leading economic power and a regional leader, one of the first in the area to begin an economic recovery. Highly unequal income distribution and crime remain pressing problems.