|
|
|
Advertisements:
EconomyEconomy - overview
The economy of Benin remains underdeveloped and dependent on subsistence agriculture, cotton production, and regional trade. Growth in real output had averaged almost 4% before the global recession but fell to 2.7% in 2009 and 2.6% in 2010. Inflation has subsided over the past several years. In order to raise growth, Benin plans to attract more foreign investment, place more emphasis on tourism, facilitate the development of new food processing systems and agricultural products, and encourage new information and communication technology. Specific projects to improve the business climate by reforms to the land tenure system, the commercial justice system, and the financial sector were included in Benin's $307 million Millennium Challenge Account grant signed in February 2006. The 2001 privatization policy continues in telecommunications, water, electricity, and agriculture. The Paris Club and bilateral creditors have eased the external debt situation with Benin benefiting from a G-8 debt reduction announced in July 2005, while pressing for more rapid structural reforms. An insufficient electrical supply continues to adversely affect Benin''s economic growth though the government recently has taken steps to increase domestic power production. Private foreign direct investment is small, and foreign aid accounts for the majority of investment in infrastructure projects. Cotton, a key export, suffered from flooding in 2010-11, but high prices supported export earnings. The government agreed to 25% increase in civil servant salaries in 2011, following a series of strikes, has increased pressure on the national budget. Benin has appealed for international assistance to mitigate piracy against commercial shipping in its territory. Gdp (purchasing power parity) World Ranking: 139
$14.87 billion (2011 est.)
$14.43 billion (2010 est.) $14.07 billion (2009 est.) Note Data are in 2011 US dollars Gdp (official exchange rate)
$7.306 billion (2011 est.)
Gdp - real growth rate World Ranking: 118
3.1% (2011 est.)
2.6% (2010 est.) 2.7% (2009 est.) Gdp - per capita (ppp) World Ranking: 200
$1,500 (2011 est.)
$1,500 (2010 est.) $1,500 (2009 est.) Note Data are in 2011 US dollars Gdp - composition by sector
Agriculture 36%
Industry 6.4% Services 57.6% (2011 est.) Labor force World Ranking: 96
3.662 million (2007 est.)
Unemployment rate
NA%
Population below poverty line
37.4% (2007 est.)
Household income or consumption by percentage share
Lowest 10% 3.1%
Highest 10% 29% (2003) Distribution of family income - gini index World Ranking: 82
36.5 (2003)
Investment (gross fixed) World Ranking: 65
22.1% of GDP (2011 est.)
Budget
Revenues $1.378 billion
Expenditures $1.69 billion (2011 est.) Taxes and other revenues World Ranking: 174
18.9% of GDP (2011 est.)
Budget surplus (+) or deficit (-) World Ranking: 141
-4.3% of GDP (2011 est.)
Public debt World Ranking: 107
31.1% of GDP
30.6% of GDP Inflation rate (consumer prices) World Ranking: 45
2.7% (2011 est.)
2.3% (2010 est.) Central bank discount rate World Ranking: 86
4.25% (31 December 2010 est.)
4.25% (31 December 2009 est.) Commercial bank prime lending rate
NA%
Stock of narrow money World Ranking: 133
$1.715 billion (31 December 2011 est.) $1.642 billion (31 December 2010 est.) Stock of broad money World Ranking: 143
$2.716 billion (31 December 2011 est.) $2.593 billion (31 December 2010 est.) Stock of domestic credit World Ranking: 151
$1.162 billion (31 December 2011 est.) $1.209 billion (31 December 2010 est.) Market value of publicly traded shares
$NA
Agriculture - products
Cotton, corn, cassava (manioc), yams, beans, palm oil, peanuts, cashews; livestock Industries
Textiles, food processing, construction materials, cement Industrial production growth rate World Ranking: 106
3% (2010 est.)
Electricity - production World Ranking: 188
128 million kWh (2008 est.)
Electricity - consumption World Ranking: 154
653 million kWh (2008 est.)
Electricity - exports
0 kWh (2009 est.)
Electricity - imports
651 million kWh (2008 est.)
Oil - production World Ranking: 152
0 bbl/day (2010 est.)
Oil - consumption World Ranking: 120
25,000 bbl/day (2010 est.)
Oil - exports World Ranking: 92
10,840 bbl/day (2009 est.)
Oil - imports World Ranking: 98
33,410 bbl/day (2009 est.)
Oil - proved reserves World Ranking: 92
8 million bbl (1 January 2011 est.) Natural gas - production World Ranking: 153
0 cu m (2009 est.)
Natural gas - consumption World Ranking: 152
0 cu m (2009 est.)
Natural gas - exports World Ranking: 62
0 cu m (2009 est.)
Natural gas - imports World Ranking: 156
0 cu m (2009 est.)
Natural gas - proved reserves World Ranking: 98
1.133 billion cu m (1 January 2011 est.) Current account balance World Ranking: 110
-$620.6 million (2011 est.)
-$526.5 million (2010 est.) Exports World Ranking: 144
$1.849 billion (2011 est.)
$1.487 billion (2010 est.) Exports - commodities
Cotton, cashews, shea butter, textiles, palm products, seafood Exports - partners
India 30.8%, China 20.2%, Indonesia 6.9%, Niger 4.9%, Singapore 4.5%, Nigeria 4.3% (2011) Imports World Ranking: 156
$2.213 billion (2011 est.)
$1.802 billion (2010 est.) Imports - commodities
Foodstuffs, capital goods, petroleum products Imports - partners
China 31.3%, France 12.3%, UK 7.6%, US 6.8%, India 5.8%, Netherlands 4.6%, Belgium 4.3% (2011) Reserves of foreign exchange and gold World Ranking: 134
$887.2 million (31 December 2011 est.) $1.2 billion (31 December 2010 est.) Debt - external World Ranking: 144
$1.395 billion (31 December 2011 est.) $1.221 billionExchange rates
Communaute Financiere Africaine francs (XOF) per US dollar - 471.87 (2011 est.)495.28 (2010 est.) 472.19 (2009) 447.81 (2008) 493.51 (2007) Fiscal year
Calendar year
Comments
Add a new comment: |
Advertisement
Members area
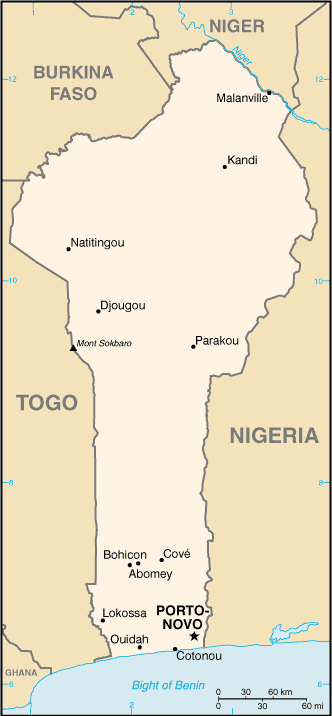
Benin (Porto-novo):
GPS points from Benin (Porto-novo)
|
||||||||
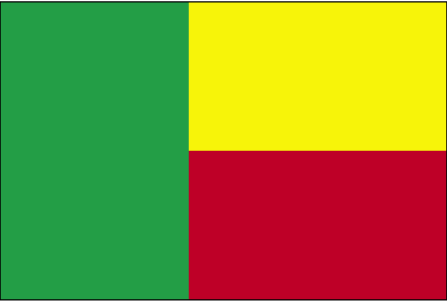
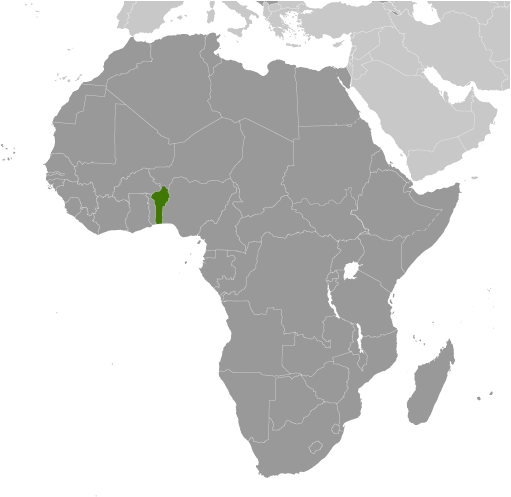
 Present day Benin was the site of Dahomey, a prominent West African kingdom that rose in the 15th century. The territory became a French Colony in 1872 and achieved independence on 1 August 1960, as the Republic of Benin. A succession of military governments ended in 1972 with the rise to power of Mathieu KEREKOU and the establishment of a government based on Marxist-Leninist principles. A move to representative government began in 1989. Two years later, free elections ushered in former Prime Minister Nicephore SOGLO as president, marking the first successful transfer of power in Africa from a dictatorship to a democracy. KEREKOU was returned to power by elections held in 1996 and 2001, though some irregularities were alleged. KEREKOU stepped down at the end of his second term in 2006 and was succeeded by Thomas YAYI Boni, a political outsider and independent. YAYI, who won a second five-year term in March 2011, has attempted to stem corruption and has strongly promoted accelerating Benin's economic growth.