|
|
|
Advertisements:
EconomyEconomy - overview
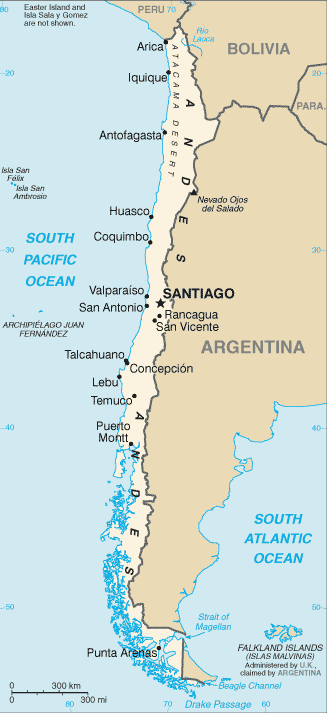
Chile has a market-oriented economy characterized by a high level of foreign trade and a reputation for strong financial institutions and sound policy that have given it the strongest sovereign bond rating in South America. Exports account for more than one-third of GDP, with commodities making up some three-quarters of total exports. Copper alone provides one-third of government revenue. During the early 1990s, Chile's reputation as a role model for economic reform was strengthened when the democratic government of Patricio AYLWIN - which took over from the military in 1990 - deepened the economic reform initiated by the military government. Since 1999, growth has averaged 4% per year. Chile deepened its longstanding commitment to trade liberalization with the signing of a free trade agreement with the US, which took effect on 1 January 2004. Chile claims to have more bilateral or regional trade agreements than any other country. It has 59 such agreements (not all of them full free trade agreements), including with the European Union, Mercosur, China, India, South Korea, and Mexico. Over the past seven years, foreign direct investment inflows have quadrupled to some $15 billion in 2010, but foreign direct investment had dropped to about $7 billion in 2009 in the face of diminished investment throughout the world. The Chilean government conducts a rule-based countercyclical fiscal policy, accumulating surpluses in sovereign wealth funds during periods of high copper prices and economic growth, and allowing deficit spending only during periods of low copper prices and growth. As of November 2011, those sovereign wealth funds - kept mostly outside the country and separate from Central Bank reserves - amounted to more than $18 billion. Chile used this fund to finance fiscal stimulus packages during the 2009 economic downturn. In December 2009, the OECD invited Chile to become a full member, after a two year period of compliance with organization mandates, and in May 2010 Chile signed the OECD Convention, becoming the first South American country to join the OECD. The economy started to show signs of a rebound in the fourth quarter of 2009, and GDP grew 5.1% in 2010 and 6.5% in 2011. Chile achieved this growth despite the 8.8 magnitude earthquake that struck in February 2010, which was one of the top 10 strongest earthquakes on record. The earthquake and subsequent tsunamis it generated caused considerable damage near the epicenter, located about 70 miles from Concepcion - and about 200 miles southwest of Santiago. Gdp (purchasing power parity) World Ranking: 43
$303.5 billion (2011 est.)
$286.5 billion (2010 est.) $269.9 billion (2009 est.) Note Data are in 2011 US dollars Gdp (official exchange rate)
$248.4 billion (2011 est.)
Gdp - real growth rate World Ranking: 48
5.9% (2011 est.)
6.1% (2010 est.) -0.9% (2009 est.) Gdp - per capita (ppp) World Ranking: 70
$17,400 (2011 est.)
$16,700 (2010 est.) $15,900 (2009 est.) Note Data are in 2011 US dollars Gdp - composition by sector
Agriculture 5.1%
Industry 41.8% Services 53.1% (2010 est.) Labor force World Ranking: 59
8.099 million (2011 est.)
Labor force - by occupation
Agriculture 13.2%
Industry 23% Services 63.9% (2005) Unemployment rate World Ranking: 75
6.6% (2011 est.)
7.1% (2010 est.) Population below poverty line
15.1% (2009 est.)
Household income or consumption by percentage share
Lowest 10% 1.5%
Highest 10% 42.8% (2009 est.) Distribution of family income - gini index World Ranking: 15
52.1 (2009)
57.1 (2000) Investment (gross fixed) World Ranking: 56
23.2% of GDP (2011 est.)
Budget
Revenues $55.53 billion
Expenditures $51.82 billion (2011 est.) Taxes and other revenues World Ranking: 142
22.4% of GDP (2011 est.)
Budget surplus (+) or deficit (-) World Ranking: 30
1.5% of GDP (2011 est.)
Public debt World Ranking: 132
9.2% of GDP (2011 est.)
9.2% of GDP (2010 est.) Inflation rate (consumer prices) World Ranking: 69
3.3% (2011 est.)
1.4% (2010 est.) Central bank discount rate World Ranking: 138
3.12% (31 December 2010 est.)
0.5% (31 December 2009 est.) Commercial bank prime lending rate World Ranking: 158
9.03% (31 December 2011 est.)
4.753% (31 December 2010 est.) Stock of narrow money World Ranking: 56
$31.96 billion (31 December 2011 est.) $34.39 billion (31 December 2010 est.) Stock of broad money World Ranking: 43
$193.2 billion (31 December 2011 est.) $160.3 billion (31 December 2009 est.) Stock of domestic credit World Ranking: 41
$175.2 billion (31 December 2011 est.) $160.7 billion (31 December 2010 est.) Market value of publicly traded shares World Ranking: 26
$270.3 billion (31 December 2011) $341.6 billion (31 December 2010) $209.5 billion (31 December 2009) Agriculture - products
Grapes, apples, pears, onions, wheat, corn, oats, peaches, garlic, asparagus, beans; beef, poultry, wool; fish; timber Industries
Copper, lithium, other minerals, foodstuffs, fish processing, iron and steel, wood and wood products, transport equipment, cement, textiles Industrial production growth rate World Ranking: 51
6.3% (2011 est.)
Electricity - production World Ranking: 42
60.28 billion kWh (2008 est.)
Electricity - consumption World Ranking: 43
56.35 billion kWh (2008 est.)
Electricity - exports
0 kWh (2009 est.)
Electricity - imports
818 million kWh (2009 est.)
Oil - production World Ranking: 87
10,640 bbl/day (2010 est.)
Oil - consumption World Ranking: 42
302,700 bbl/day (2010 est.)
Oil - exports World Ranking: 76
52,390 bbl/day (2009 est.)
Oil - imports World Ranking: 33
305,100 bbl/day (2009 est.)
Oil - proved reserves World Ranking: 64
150 million bbl (1 January 2011 est.) Natural gas - production World Ranking: 61
1.35 billion cu m (2009 est.)
Natural gas - consumption World Ranking: 76
2.84 billion cu m (2009 est.)
Natural gas - exports World Ranking: 78
0 cu m (2009 est.)
Natural gas - imports World Ranking: 53
1.49 billion cu m (2009 est.)
Natural gas - proved reserves World Ranking: 56
97.97 billion cu m (1 January 2011 est.) Current account balance World Ranking: 159
-$3.231 billion (2011 est.)
$3.802 billion (2010 est.) Exports World Ranking: 48
$81.71 billion (2011 est.)
$71.03 billion (2010 est.) Exports - commodities
Copper, fruit, fish products, paper and pulp, chemicals, wine Exports - partners
China 22.4%, US 11.3%, Japan 11%, Brazil 5.5%, South Korea 5.4%, Netherlands 4.7% (2011) Imports World Ranking: 45
$70.92 billion (2011 est.)
$55.17 billion (2010 est.) Imports - commodities
Petroleum and petroleum products, chemicals, electrical and telecommunications equipment, industrial machinery, vehicles, natural gas Imports - partners
US 20.9%, China 17.9%, Brazil 8.8%, Argentina 6.7%, Japan 4.2% (2011) Reserves of foreign exchange and gold World Ranking: 44
$41.94 billion (31 December 2011 est.) $27.83 billion (31 December 2010 est.) Debt - external World Ranking: 46
$99.4 billion (31 December 2011 est.) $86.35 billion (31 December 2010 est.) Stock of direct foreign investment - at home World Ranking: 26
$154.3 billion (31 December 2011 est.) $139.5 billion (31 December 2010 est.) Stock of direct foreign investment - abroad World Ranking: 32
$56.09 billion (31 December 2011 est.) $49.84 billion (31 December 2010 est.) Exchange rates
Chilean pesos (CLP) per US dollar - 483.67 (2011 est.)510.25 (2010 est.) 560.86 (2009) 509.02 (2008) 526.25 (2007) Fiscal year
Calendar year
Comments
Add a new comment: |
Advertisement
Members area
Chile (Santiago):
GPS points from Chile (Santiago)
|
||||||||
 Prior to the arrival of the Spanish in the 16th century, the Inca ruled northern Chile while the indigenous Mapuche inhabited central and southern Chile. Although Chile declared its independence in 1810, decisive victory over the Spanish was not achieved until 1818. In the War of the Pacific (1879-83), Chile defeated Peru and Bolivia and won its present northern regions. It was not until the 1880s that the Mapuche Indians were completely subjugated. After a series of elected governments, the three-year-old Marxist government of Salvador ALLENDE was overthrown in 1973 by a military coup led by Augusto PINOCHET, who ruled until a freely elected president was installed in 1990. Sound economic policies, maintained consistently since the 1980s, have contributed to steady growth, reduced poverty rates by over half, and have helped secure the country's commitment to democratic and representative government. Chile has increasingly assumed regional and international leadership roles befitting its status as a stable, democratic nation.