|
|
|
Advertisements:
EconomyEconomy - overview
Papua New Guinea (PNG) is richly endowed with natural resources, but exploitation has been hampered by rugged terrain, land tenure issues, and the high cost of developing infrastructure. The economy has a small formal sector, focused mainly on the export of those natural resources, and an informal sector, employing the majority of the population. Agriculture provides a subsistence livelihood for 85% of the people. Mineral deposits, including copper, gold, and oil, account for nearly two-thirds of export earnings. Natural gas reserves amount to an estimated 227 billion cubic meters. A consortium led by a major American oil company is constructing a liquefied natural gas (LNG) production facility that could begin exporting in 2014. As the largest investment project in the country's history, it has the potential to double GDP in the near-term and triple Papua New Guinea's export revenue. An American-owned firm also opened PNG's first oil refinery in 2004 and is building a second LNG production facility. The government faces the challenge of ensuring transparency and accountability for revenues flowing from this and other large LNG projects. In 2011 and 2012, the National Parliament passed legislation that created an offshore Sovereign Wealth Fund (SWF) to manage government surpluses from mineral, oil, and natural gas projects. In recent years, the government has opened up markets in telecommunications and air transport, making both more affordable to the people. Numerous challenges still face the government of Peter O'NEILL, including providing physical security for foreign investors, regaining investor confidence, restoring integrity to state institutions, promoting economic efficiency by privatizing moribund state institutions, and maintaining good relations with Australia, its former colonial ruler. Other socio-cultural challenges could upend the economy including chronic law and order and land tenure issues. The global financial crisis had little impact because of continued foreign demand for PNG's commodities. Gdp (purchasing power parity) World Ranking: 136
$17.08 billion (2011 est.)
$15.68 billion (2010 est.) $14.58 billion (2009 est.) Note Data are in 2011 US dollars Gdp (official exchange rate)
$12.66 billion (2011 est.)
Gdp - real growth rate World Ranking: 12
8.9% (2011 est.)
7.6% (2010 est.) 6.1% (2009 est.) Gdp - per capita (ppp) World Ranking: 177
$2,600 (2011 est.)
$2,400 (2010 est.) $2,300 (2009 est.) Note Data are in 2011 US dollars Gdp - composition by sector
Agriculture 29.9%
Industry 37.6% Services 32.4% (2011 est.) Labor force World Ranking: 91
3.896 million (2011 est.)
Labor force - by occupation
Agriculture 85%
Industry NA% Services NA% (2005 est.) Unemployment rate World Ranking: 10
1.9% (2008 est.)
1.8% (2004) Population below poverty line
37% (2002 est.)
Household income or consumption by percentage share
Lowest 10% 1.7%
Highest 10% 40.5% (1996) Distribution of family income - gini index World Ranking: 19
50.9 (1996)
Investment (gross fixed) World Ranking: 109
19% of GDP (2011 est.)
Budget
Revenues $4.168 billion
Expenditures $4.194 billion (2011 est.) Taxes and other revenues World Ranking: 76
32.9% of GDP (2011 est.)
Budget surplus (+) or deficit (-) World Ranking: 48
-0.2% of GDP (2011 est.)
Public debt World Ranking: 118
22.1% of GDP (2011 est.)
25.7% of GDP (2010 est.) Inflation rate (consumer prices) World Ranking: 180
8.5% (2011 est.)
6.1% (2010 est.) Central bank discount rate World Ranking: 46
14% (31 December 2010 est.)
6.92% (31 December 2009 est.) Commercial bank prime lending rate World Ranking: 88
10.81% (31 December 2011 est.)
10.45% (31 December 2010 est.) Stock of narrow money World Ranking: 104
$4.488 billion (31 December 2011 est.) $2.893 billion (31 December 2010 est.) Stock of broad money World Ranking: 115
$7.13 billion (31 December 2011 est.) $4.933 billion (31 December 2010 est.) Stock of domestic credit World Ranking: 121
$3.708 billion (31 December 2011 est.) $2.647 billion (31 December 2010 est.) Market value of publicly traded shares World Ranking: 72
$8.999 billion (31 December 2011) $9.742 billion (31 December 2010) $12.21 billion (31 December 2009) Agriculture - products
Coffee, cocoa, copra, palm kernels, tea, sugar, rubber, sweet potatoes, fruit, vegetables, vanilla; poultry, pork; shellfish Industries
Copra crushing, palm oil processing, plywood production, wood chip production; mining (gold, silver, and copper); crude oil production, petroleum refining; construction, tourism Industrial production growth rate World Ranking: 14
10% (2010 est.)
Electricity - production World Ranking: 126
2.965 billion kWh (2008 est.)
Electricity - consumption World Ranking: 131
2.757 billion kWh (2008 est.)
Electricity - exports
0 kWh (2009 est.)
Electricity - imports
0 kWh (2009 est.)
Oil - production World Ranking: 69
30,570 bbl/day (2010 est.)
Oil - consumption World Ranking: 109
33,000 bbl/day (2010 est.)
Oil - exports World Ranking: 98
8,029 bbl/day (2009 est.)
Oil - imports World Ranking: 129
14,770 bbl/day (2009 est.)
Oil - proved reserves World Ranking: 73
88 million bbl (1 January 2011 est.) Natural gas - production World Ranking: 77
130 million cu m (2009 est.)
Natural gas - consumption World Ranking: 103
130 million cu m (2009 est.)
Natural gas - exports World Ranking: 159
0 cu m (2009 est.)
Natural gas - imports World Ranking: 110
0 cu m (2009 est.)
Natural gas - proved reserves World Ranking: 44
226.5 billion cu m (1 January 2011 est.) Current account balance World Ranking: 166
-$4.818 billion (2011 est.)
-$913.5 million (2010 est.) Exports World Ranking: 106
$6.748 billion (2011 est.)
$5.745 billion (2010 est.) Exports - commodities
Oil, gold, copper ore, logs, palm oil, coffee, cocoa, crayfish, prawns Exports - partners
Australia 31.2%, Japan 7.1%, China 6.1% (2011) Imports World Ranking: 121
$6.106 billion (2011 est.)
$3.529 billion (2010 est.) Imports - commodities
Machinery and transport equipment, manufactured goods, food, fuels, chemicals Imports - partners
Australia 38.5%, Singapore 14.7%, China 7.3%, Malaysia 5.5%, Japan 5.2%, Indonesia 4.9%, US 4.9% (2011) Reserves of foreign exchange and gold World Ranking: 92
$4.445 billion (31 December 2011 est.) $3.092 billion (31 December 2010 est.) Debt - external World Ranking: 113
$5.296 billion (31 December 2011 est.) $5.574 billion (31 December 2010 est.) Stock of direct foreign investment - at home
$NA
Stock of direct foreign investment - abroad
$NA
Exchange rates
Kina (PGK) per US dollar -
2.371 (2011 est.) 2.7193 (2010 est.) 2.7551 (2009) 2.6956 (2008) 3.03 (2007) Fiscal year
Calendar year
Comments
Add a new comment: |
Advertisement
Members area
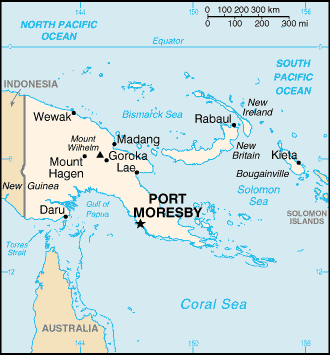
Papua New Guinea (Port Moresby):
GPS points from Papua New Guinea (Port Moresby)
|
||||||||
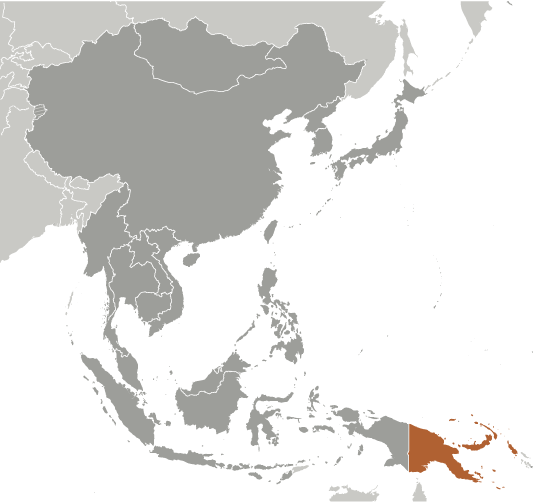
 The eastern half of the island of New Guinea - second largest in the world - was divided between Germany (north) and the UK (south) in 1885. The latter area was transferred to Australia in 1902, which occupied the northern portion during World War I and continued to administer the combined areas until independence in 1975. A nine-year secessionist revolt on the island of Bougainville ended in 1997 after claiming some 20,000 lives.