|
|
|
Advertisements:
EconomyEconomy - overview
Estonia, a 2004 European Union entrant, has a modern market-based economy and one of the higher per capita income levels in Central Europe and the Baltic region. Estonia's successive governments have pursued a free market, pro-business economic agenda and have wavered little in their commitment to pro-market reforms. The current government has followed sound fiscal policies that have resulted in balanced budgets and low public debt. The economy benefits from strong electronics and telecommunications sectors and strong trade ties with Finland, Sweden, Russia, and Germany. Tallinn's priority has been to sustain high growth rates - on average 8% per year from 2003 to 2007. Estonia's economy fell sharply into recession in mid-2008, primarily as a result of an investment and consumption slump following the bursting of the real estate market bubble. Estonia has rebounded well from the economic crisis. GDP contracted 14.3% in 2009, but the Estonian economy now has the highest GDP growth rate in Europe, largely thanks to a boom in exports and increased foreign investment following Estonia's adoption of the euro on 1 January 2011. Although Estonian GDP returned to positive growth in 2010, unemployment continued to rise, reaching an all time high of 19.8% in early 2010. Gdp (purchasing power parity) World Ranking: 112
$27.66 billion (2011 est.)
$25.7 billion (2010 est.) $25.13 billion (2009 est.) Note Data are in 2011 US dollars Gdp (official exchange rate)
$22.23 billion (2011 est.)
Gdp - real growth rate World Ranking: 21
7.6% (2011 est.)
2.3% (2010 est.) -14.3% (2009 est.) Gdp - per capita (ppp) World Ranking: 61
$20,600 (2011 est.)
$19,200 (2010 est.) $18,700 (2009 est.) Note Data are in 2011 US dollars Gdp - composition by sector
Agriculture 3.5%
Industry 28.5% Services 61% (2011 est.) Labor force World Ranking: 152
704,400 (2011 est.)
Labor force - by occupation
Agriculture 4.2%
Industry 20.2% Services 75.6% (2010) Unemployment rate World Ranking: 127
12.1% (2011 est.)
16.9% (2010 est.) Population below poverty line
17.5% (2010)
Household income or consumption by percentage share
Lowest 10% 2.7%
Highest 10% 27.7% (2004) Distribution of family income - gini index World Ranking: 107
31.3 (2010)
37 (1999) Investment (gross fixed) World Ranking: 73
21.5% of GDP (2011 est.)
Budget
Revenues $8.491 billion
Expenditures $8.646 billion (2011 est.) Taxes and other revenues World Ranking: 55
38.2% of GDP (2011 est.)
Budget surplus (+) or deficit (-) World Ranking: 53
-0.7% of GDP (2011 est.)
Public debt World Ranking: 138
5.9% of GDP (2011 est.)
6.6% of GDP (2010 est.) Note Data cover general government debt, and includes debt instruments issued (or owned) by government entities, including sub-sectors of central government, state government, local government, and social security funds Inflation rate (consumer prices) World Ranking: 124
5% (2011 est.)
3% (2010 est.) Commercial bank prime lending rate World Ranking: 121
6.12% (31 December 2011 est.)
7.759% (31 December 2010 est.) Stock of narrow money World Ranking: 87
$7.06 billion (31 December 2011 est.) $6.614 billion (31 December 2010 est.) Note This figure represents the US dollar value of Estonian kroon in circulation prior to Estonia's joining the Economic and Monetary Union (EMU); see entry for the European Union for money supply in the euro area; the European Central Bank (ECB) controls monetary policy for the 17 members of the EMU; individual members of the EMU do not control the quantity of money circulating within their own borders Stock of broad money World Ranking: 100
$11.57 billion (31 December 2011 est.) $11.36 billion (31 December 2010 est.) Stock of domestic credit World Ranking: 84
$19.51 billion (31 December 2011 est.) $18.95 billion (31 December 2010 est.) Market value of publicly traded shares World Ranking: 97
$1.611 billion (31 December 2011) $2.26 billion (31 December 2010) $2.654 billion (31 December 2009) Agriculture - products
Grain, potatoes, vegetables; livestock and dairy products; fish Industries
Engineering, electronics, wood and wood products, textiles; information technology, telecommunications Industrial production growth rate World Ranking: 3
18% (2011 est.)
Electricity - production World Ranking: 87
12.96 billion kWh (2010 est.)
Electricity - consumption World Ranking: 99
7.431 billion kWh (2010 est.)
Electricity - exports
4.354 billion kWh (2010 est.)
Electricity - imports
1.1 billion kWh (2010 est.)
Oil - production World Ranking: 93
7,642 bbl/day (2010 est.)
Oil - consumption World Ranking: 113
31,000 bbl/day (2010 est.)
Oil - exports World Ranking: 153
0 bbl/day (2009 est.)
Oil - imports World Ranking: 102
28,520 bbl/day (2009 est.)
Oil - proved reserves World Ranking: 127
0 bbl (1 January 2011 est.)
Natural gas - production World Ranking: 176
0 cu m (2010 est.)
Natural gas - consumption World Ranking: 90
701 million cu m (2010 est.)
Natural gas - exports World Ranking: 93
0 cu m (2010 est.)
Natural gas - imports World Ranking: 64
701 million cu m (2010 est.)
Natural gas - proved reserves World Ranking: 173
0 cu m (1 January 2011 est.)
Current account balance World Ranking: 45
$707.6 million (2011 est.)
$621.8 million (2010 est.) Exports World Ranking: 77
$16.84 billion (2011 est.)
$11.66 billion (2010 est.) Exports - commodities
Machinery and electrical equipment 21%, wood and wood products 9%, metals 9%, furniture 7%, vehicles and parts 5%, food products and beverages 4%, textiles 4%, plastics 3% Exports - partners
Sweden 17%, Finland 16.3%, Russia 11.9%, Latvia 8.6%, Germany 4.9%, Lithuania 4.9% (2011) Imports World Ranking: 80
$17.09 billion (2011 est.)
$11.94 billion (2010 est.) Imports - commodities
Machinery and electrical equipment 22%, mineral fuels 18%, chemical products 3%, foodstuffs 6%, plastics 6%, textiles 5% Imports - partners
Finland 13.4%, Latvia 11.6%, Sweden 11.3%, Germany 10.9%, Lithuania 8.7%, Poland 7.2%, China 4.7% (2011) Reserves of foreign exchange and gold World Ranking: 146
$409 million (31 December 2011 est.) $2.568 billion (31 December 2010 est.) Debt - external World Ranking: 73
$25.22 billion (31 December 2011 est.) $22.03 billion (31 December 2010 est.) Stock of direct foreign investment - at home World Ranking: 72
$16.57 billion (31 December 2011 est.) $16.39 billion (31 December 2010 est.) Stock of direct foreign investment - abroad World Ranking: 55
$7.524 billion (31 December 2011 est.) $6.029 billion (31 December 2010 est.) Exchange rates
Kroon (EEK) per US dollar -
0.71 (2011 est.) 11.81 (2010 est.) 11.23 (2009) 10.7 (2008) 11.535 (2007) Fiscal year
Calendar year
Comments
Add a new comment: |
Advertisement
Members area
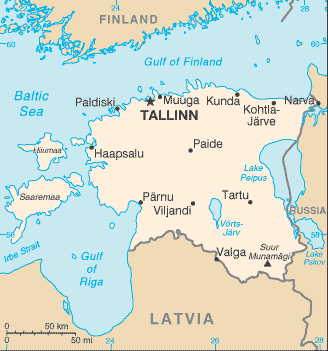
Estonia (Tallinn):
GPS points from Estonia (Tallinn)
|
||||||||
 After centuries of Danish, Swedish, German, and Russian rule, Estonia attained independence in 1918. Forcibly incorporated into the USSR in 1940 - an action never recognized by the US - it regained its freedom in 1991 with the collapse of the Soviet Union. Since the last Russian troops left in 1994, Estonia has been free to promote economic and political ties with the West. It joined both NATO and the EU in the spring of 2004, formally joined the OECD in late 2010, and adopted the euro as its official currency on 1 January 2011.