|
|
Advertisements:
EconomyEconomy - overview
Hong Kong has a free market economy, highly dependent on international trade and finance - the value of goods and services trade, including the sizable share of re-exports, is about four times GDP. Hong Kong's open economy left it exposed to the global economic slowdown that began in 2008. Although increasing integration with China, through trade, tourism, and financial links, helped it to make an initial recovery more quickly than many observers anticipated, it again faces a possible slowdown as exports to the Euro zone and US slump. The Hong Kong government is promoting the Special Administrative Region (SAR) as the site for Chinese renminbi (RMB) internationalization. Hong Kong residents are allowed to establish RMB-denominated savings accounts; RMB-denominated corporate and Chinese government bonds have been issued in Hong Kong; and RMB trade settlement is allowed. The territory far exceeded the RMB conversion quota set by Beijing for trade settlements in 2010 due to the growth of earnings from exports to the mainland. RMB deposits grew to roughly 7.8% of total system deposits in Hong Kong by the end of 2011, an increase of over 59% since the beginning of the year. The government is pursuing efforts to introduce additional use of RMB in Hong Kong financial markets and is seeking to expand the RMB quota. The mainland has long been Hong Kong's largest trading partner, accounting for about half of Hong Kong's exports by value. Hong Kong's natural resources are limited, and food and raw materials must be imported. As a result of China's easing of travel restrictions, the number of mainland tourists to the territory has surged from 4.5 million in 2001 to 28 million in 2011, outnumbering visitors from all other countries combined. Hong Kong has also established itself as the premier stock market for Chinese firms seeking to list abroad. In 2011 mainland Chinese companies constituted about 43% of the firms listed on the Hong Kong Stock Exchange and accounted for about 56% of the Exchange's market capitalization. During the past decade, as Hong Kong's manufacturing industry moved to the mainland, its service industry has grown rapidly. Growth slowed to 5% in 2011. Credit expansion and tight housing supply conditions caused Hong Kong property prices to rise rapidly in 2010 and inflation to rise 5.3% in 2011. Lower and middle income segments of the population are increasingly unable to afford adequate housing. Hong Kong continues to link its currency closely to the US dollar, maintaining an arrangement established in 1983. Gdp (purchasing power parity) World Ranking: 37
$355.6 billion (2011 est.)
$338.8 billion (2010 est.) $316.5 billion (2009 est.) Note Data are in 2011 US dollars Gdp (official exchange rate)
$243.3 billion (2011 est.)
Gdp - real growth rate World Ranking: 67
5% (2011 est.)
7% (2010 est.) -2.6% (2009 est.) Gdp - per capita (ppp) World Ranking: 10
$49,800 (2011 est.)
$47,700 (2010 est.) $44,900 (2009 est.) Note Data are in 2011 US dollars Gdp - composition by sector
Agriculture 0.1%
Industry 6.8% Services 93.2% (2011 est.) Labor force World Ranking: 93
3.703 million (2011 est.)
Labor force - by occupation
Manufacturing 4.3%
Construction 2.4% Wholesale and retail trade, restaurants, and hotels 41.4% Financing, insurance, and real estate 12.5% Transport and communications 6.3% Community and social services 16.8% Note Above data exclude public sector (2011 est.) Unemployment rate World Ranking: 30
3.4% (2011 est.)
4.3% (2010 est.) Population below poverty line
NA%
Household income or consumption by percentage share
Lowest 10% NA%
Highest 10% NA% Distribution of family income - gini index World Ranking: 13
53.3 (2007)
Investment (gross fixed) World Ranking: 68
21.9% of GDP (2011 est.)
Budget
Revenues $55.53 billion
Expenditures $46.97 billion (2011 est.) Taxes and other revenues World Ranking: 137
22.8% of GDP (2011 est.)
Budget surplus (+) or deficit (-) World Ranking: 21
3.5% of GDP (2011 est.)
Public debt World Ranking: 108
30.1% of GDP (2011 est.)
42.6% of GDP (2010 est.) Inflation rate (consumer prices) World Ranking: 138
5.3% (2011 est.)
2.3% (2010 est.) Central bank discount rate World Ranking: 137
0.5% (31 December 2011)
0.5% (31 December 2010) Commercial bank prime lending rate World Ranking: 156
5% (31 December 2011 est.)
5% (31 December 2010 est.) Stock of narrow money World Ranking: 23
$143.8 billion (31 December 2011 est.) $130.4 billion (31 December 2010) Stock of broad money World Ranking: 19
$1.028 trillion (31 December 2011 est.) $917.5 billion (31 December 2010) Stock of domestic credit World Ranking: 27
$540.7 billion (31 December 2011 est.) $463.7 billion (31 December 2010 est.) Market value of publicly traded shares World Ranking: 6
$2.24 trillion (31 December 2011) $2.711 trillion (31 December 2010) $2.292 trillion (31 December 2009 est.) Agriculture - products
Fresh vegetables; poultry, pork; fish Industries
Textiles, clothing, tourism, banking, shipping, electronics, plastics, toys, watches, clocks Industrial production growth rate World Ranking: 141
0.8% (2011 est.)
Electricity - production World Ranking: 54
41.22 billion kWh (2011 est.)
Electricity - consumption World Ranking: 49
43.14 billion kWh (2011 est.)
Electricity - exports
2.75 billion kWh (2011 est.)
Electricity - imports
10.75 billion kWh (2011 est.)
Oil - production World Ranking: 183
0 bbl/day (2011 est.)
Oil - consumption World Ranking: 41
303,800 bbl/day (2011 est.)
Oil - exports World Ranking: 88
18,750 bbl/day (2011 est.)
Oil - imports World Ranking: 28
375,000 bbl/day (2011)
Oil - proved reserves World Ranking: 143
0 bbl (1 January 2012 est.)
Natural gas - production World Ranking: 194
0 cu m (2011 est.)
Natural gas - consumption World Ranking: 67
3.46 billion cu m (2011 est.)
Natural gas - exports World Ranking: 114
0 cu m (2011 est.)
Natural gas - imports World Ranking: 40
3.46 billion cu m (2011 est.)
Natural gas - proved reserves World Ranking: 188
0 cu m (1 January 2011 est.)
Current account balance World Ranking: 28
$9.42 billion (2011 est.)
$12.39 billion (2010 est.) Exports World Ranking: 13
$427.9 billion (2011 est.)
$394 billion (2010 est.) Exports - commodities
Electrical machinery and appliances, textiles, apparel, footwear, watches and clocks, toys, plastics, precious stones, printed material Exports - partners
China 52.4%, US 9.9%, Japan 4% (2011 est.) Imports World Ranking: 11
$482.6 billion (2011 est.)
$437 billion (2010 est.) Imports - commodities
Raw materials and semi-manufactures, consumer goods, capital goods, foodstuffs, fuel (most is reexported) Imports - partners
China 44.9%, Japan 8.9%, Taiwan 7.5%, US 4.9% (2011 est.) Reserves of foreign exchange and gold World Ranking: 11
$285.4 billion (31 December 2011 est.) $268.7 billion (31 December 2010 est.) Debt - external World Ranking: 17
$903.2 billion (30 June 2011 est.) $750.8 billion (31 December 2010 est.) Stock of direct foreign investment - at home World Ranking: 3
$1.155 trillion (31 December 2011 est.) $1.09 trillion (31 December 2010 est.) Stock of direct foreign investment - abroad World Ranking: 5
$997.1 billion (31 December 2011 est.) $936 billion (31 December 2010 est.) Exchange rates
Hong Kong dollars (HKD) per US dollar - 7.784 (2011 est.)7.77 (2010 est.) 7.75 (2009) 7.751 (2008) 7.802 (2007) Fiscal year
1 April - 31 March
Comments
Add a new comment: |
Advertisement
Members area
Hong Kong S. A. R. (Special Administrative Region):
 
GPS points from Hong Kong S. A. R. (Special Administrative Region)
|
||||||||

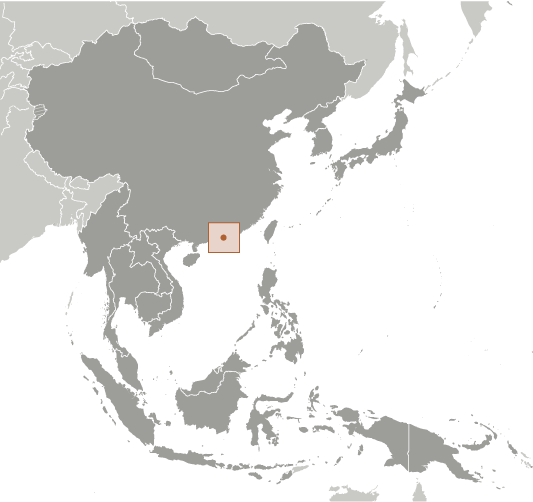
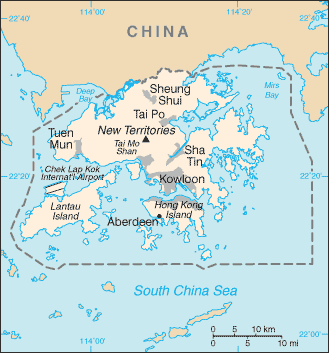
 Occupied by the UK in 1841, Hong Kong was formally ceded by China the following year; various adjacent lands were added later in the 19th century. Pursuant to an agreement signed by China and the UK on 19 December 1984, Hong Kong became the Hong Kong Special Administrative Region (SAR) of the People's Republic of China on 1 July 1997. In this agreement, China promised that, under its "one country, two systems" formula, China's socialist economic system would not be imposed on Hong Kong and that Hong Kong would enjoy a high degree of autonomy in all matters except foreign and defense affairs for the next 50 years.